
Social Pilot: 36 important Facebook Statistics and Facts from 2023
Imagine this: every day, 2.06 billion people wake up in the morning and log into Facebook. That's not just a staggering number; it's a testament to the platform's unparalleled reach.
Did you know thousands of new users sign up for Facebook every second? Or that the average Facebook user spends over 35 minutes daily browsing through their feed? And while you might be reading this from the US or UK, it's India that boasts the most Facebook users.
But that's just the tip of the iceberg. Dive in with us as we unravel 36 intriguing Facebook statistics neatly categorized to aid your strategies.
You may ask, what sort of Facebook statistics are covered?
Here they are:
- General Facebook facts
- Facebook usage statistics
- Facebook demographics statistics
- Facebook engagement statistics
- Facebook business statistics
- Facebook advertising statistics
Whether you're a marketer, a business owner, or just a curious social media enthusiast, these statistics will offer a deeper understanding of the world's most popular social network.
So, ready to dive in?
Let these Facebook facts and trends do the talking!
GENERAL FACEBOOK FACTS
Facebook is where you go to stalk people, chat with your BFF, post photos, sell products through Facebook shops, or run ads.
If you're a marketer, it's the go-to spot to reach your target audience.
But you already know that.
Here are some Facebook facts that you didn't know.

photo: Social Pilot
1. Facebook has 3.030 billion monthly active users (MAUs)
As of Q2 2023, Facebook has over 3.030 billion monthly active users (MAUs), making it the largest social media app in the world. This is an increase of +41 million from 2,989 billion in Q1 2023.
Additionally, in the second quarter of 2023, the daily active users of Facebook (DAU) reached 2.06 billion, an increase of 3% YOY.
Roughly 37.2% of the global audience uses Facebook every month. Facebook is also the most used social media platform, with a growth of 2% year-over-year.
Facebook is the third most popular app among Android users in the US, while Google Chrome and Google hold the first and second positions.
Meta generated a revenue of $116.6 billion in 2022, and approximately $65 billion came from the Facebook app.
Ever wondered how much time people spend on Facebook? Or what population of the total world population uses the platform?
Here are some of the key Facebook usage statistics that will help you delve into the popularity of the platform:

photo: Social Pilot
5. Global users spend an average of 19.42 hours a month on Facebook
An average Facebook user spends 19.42 hours a month or 35 minutes daily on the platform in 2022, making it the third most engaging social media app. TikTok holds the first spot with 23.3 hours, while YouTube comes second with 23 hours a month.
As of July 2021, 81.8% of Facebook's mobile users aged 18+ accessed the platform via an app from an Android device. While 14.8% of users accessed Facebook via an app on an iOS device and 3.4% of users used the platform from a mobile web browser.
Regarding where Americans get regular news updates, Facebook outpaces almost all social media websites. A whopping 31% of users say they regularly get news from Facebook.
Over the years, Facebook has been witnessing a significant downfall in its popularity. According to a report, Facebook use among teenagers in the US dropped from 71% in 2014 – 2015 to 32% in 2022. This Facebook trend displays a 39% drop in teen usage.
Facebook isn't just a social media giant; it's a demographic powerhouse. Ever wondered who's really behind those billions of likes, shares, and posts on Facebook?
Did you know that Facebook, the social media behemoth, boasts a whopping 315 million active monthly users in India or that 7% of Gen Z users plan to quit the platform?
Hold tight and read on because all the numbers on demographics are nothing short of fascinating!

9. The 25 – 34 age group makes up the largest audience on Facebook
A recent study of Facebook age demographics shows that the 25 to 34 age group has the highest number of Facebook users. 29.4% of all active Facebook users fall within this range.
This is followed by the 18 – 24 age group, which makes up 22.6% of all Facebook users worldwide. Together, these two biggest age demographics of Facebook users make up 52% of all active Facebook users.
In 2022, approximately 71.43% of internet users in the United States used Facebook regularly, a jump from 2021's 70.18%.
When it comes to trust, social media users don't trust Facebook. In 2022, only 18% of Facebook users thought the platform protected their privacy and data, down from 27% in 2021. This is the lowest among all the social media platforms, with Twitter at 23% and TikTok at 24%.
The countries with the largest numbers of Facebook users:
- India: 315 million
- USA: 175 million
- Indonesia: 119.9 million
- Brazil: 109.05 million
- Mexico: 83.75 million
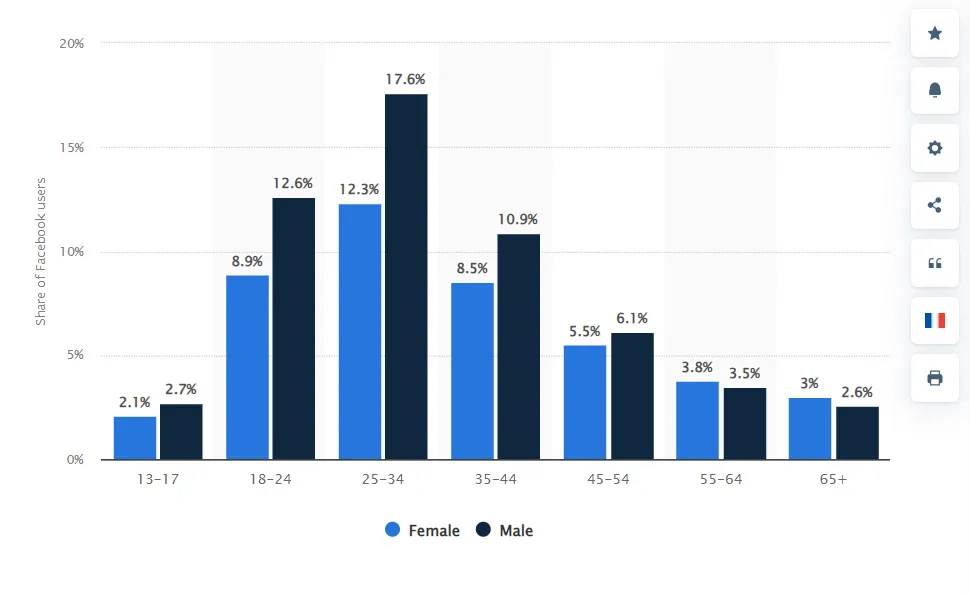
As of January 2023, in the 25-34 age group, 12.3% of all active Facebook users are female, and 17.6% are male, making up Facebook's largest audience. Additionally, Facebook's second-largest audience base are males aged 18-24, with 12.6% males.
14. 7% of Gen Z users plan to quit Facebook in 2023
About 25% of Gen Z users in America intend to use the network less frequently in 2023. 7% of users between the ages of 18 and 25 intend to quit the platform. If marketers are aware of their target group, Facebook still offers a wealth of marketing opportunities.
FACEBOOK ENAGEMENT STATISTICS
It's not just about signing up; it's about showing up. Facebook's engagement stats will have you rethinking the way you see online interaction.
What content resonates with Facebook's audience? Or how many stories get posted on Facebook every day?

15. Over 1 billion Stories get shared across Facebook apps daily
Stories creation and consumption have increased since they launched, with over 1 billion Stories shared every day across the Facebook network of apps.
The brands see a median engagement rate of 0.060% across all industries, which is higher than 0.47%, the median engagement rate of all industries on Instagram.
More than 1.8 billion people use Facebook Groups every month. There are roughly 70 million admins and moderators running active Facebook groups, and more than half of all users are in five or more groups.
This latest Facebook fact will get you hyped up. The photo posts on Facebook get the highest engagement rate at 0.12%, followed by:
- Status posts: 0.11%
- Video posts: 0.08%
- Link posts: 0.04%
62% of people in the US say that they plan to use stories even more in the future than they do today. 57% of people say Facebook stories make them feel part of a larger community and 65% say stories help them feel closer to their friends.
In Q3 2022, Facebook Gaming accumulated 382 million hours of live streams watched, down from an all-time high of 1.29 billion hours of streaming in Q3 2021.
Every 30 days, an average Facebook user likes 11 posts, leaves 5 comments, reshares one post, and clicks 12 Facebook ads.
Facebook users love live streams more than recorded videos. Facebook gets 26% higher engagement on live video streams than other social media platforms – the probability of watching a live stream is 4 times higher.
FACEBOOK BUSINESS STATISTIC
Whether you're seeking Facebook statistics for business or just the ins and outs of the platform, this is your pitstop. From Facebook page statistics to groups, discover how businesses harness its power.

23. 81% of businesses share videos on Facebook
Video marketing is surely popular among the business community. Nearly 81% of businesses share videos on Facebook.
Meta has helped several businesses make the transition online since the start of the COVID-19 pandemic. More than 200 million businesses use Meta apps every month to create virtual storefronts and reach customers.
On Facebook, the largest social media platform, 70% of users visit local business pages at least once a week
Conversation is the key to any business. Conversational Commerce already contributes to Southeast Asia's cross-channel revenue and is expected to grow exponentially. People who message a business are more likely to shop with that business and customers in emerging markets are 2.4x more likely to message a business.
The tech giant bet again on e-commerce by adding Facebook Shops. From January to March 2021, Facebook Shops reported an average of one million monthly global users and around 250 million active stores worldwide.
This statistic indicates that a considerable number of US consumers start their initial product search on Facebook. This underlines the fact that prioritizing SEO strategies on Facebook can help you get fruitful results. So, with the right marketing strategy and Facebook tools, you can drive sales through the platform.
Imagine launching an ad and, within moments, it's displayed on the screens of thousands, if not millions, of potential customers. Intriguing, isn't it? But what does it really take to create a ripple in the vast ocean of Facebook advertising?
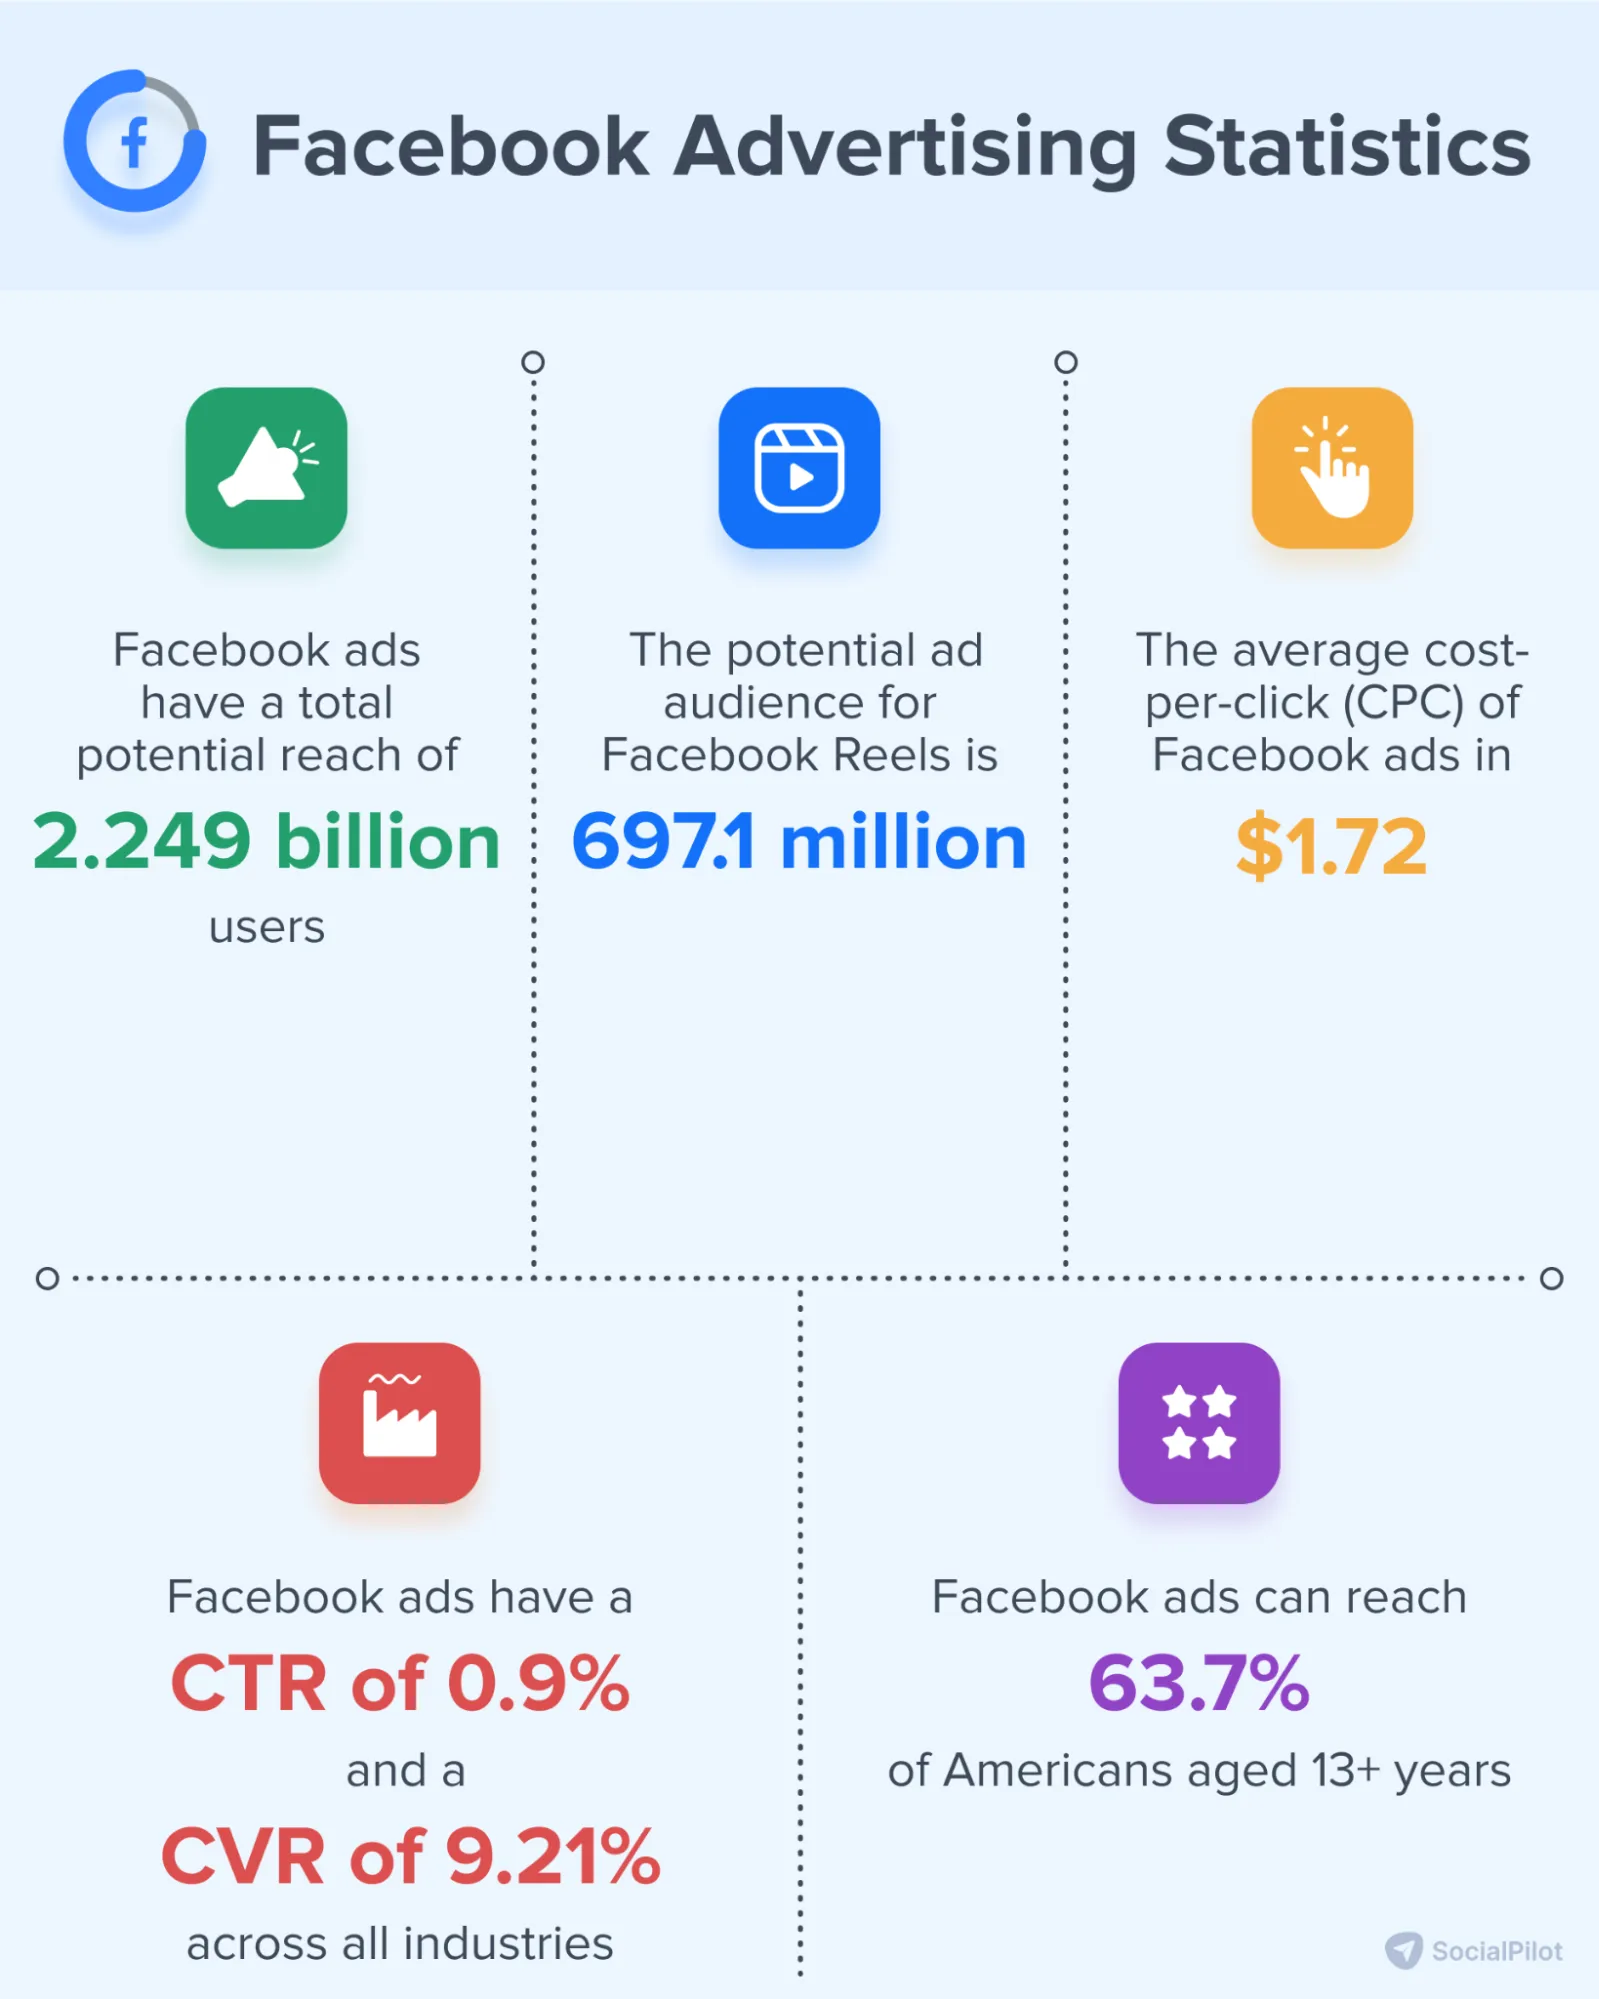
Did you know that 2.249 billion individuals are potentially reachable through Facebook advertising? Or that a staggering 93% of marketers regularly invest in Facebook ads?
That is just the tip of the iceberg, check out more of these Facebook advertising statistics:
According to Datareportal, Marketers can reach a total potential audience of 2.249 billion users through Facebook ads – as of April 2023. Thats an increase of 108 million from 1.983 billion in April 2022.
Indeed, the latest data shows that just 75.3% of Facebook's monthly active users were shown an ad on the platform in the past 30 days up to the start of April 2023. This latest Facebook ad fact shows you how wide the scope is for advertisers.
Another popular Facebook advertising trend….
In comparison to other Facebook surfaces, the following represents the possible advertising audience for different Facebook placement locations:
- Stories: 1.25 billion users
- Search results: 733.1 million
- Facebook Marketplace: 495.7 million
Although the audience for Reels ads is now lower than that of Stories ads, Facebook is strongly promoting Reels. Things get really fascinating when you look at the following Facebook statistics…
While this number might seem relatively small to you, but this is a big jump from the last year's nonexistent share. Though the format (Facebook Reels) is new, it is steadily gaining popularity and opening new opportunities for advertisers.
A study shows that Facebook ads have a CPC of $1.72 across all industries. Financial advertisers have the highest CPC on Facebook $3.77, followed by consumer services, home improvement, and employment and job training with $3.08, $2.93, and $2.72, respectively.
33. Facebook Ads have an average CTR of 0.9% and CVR of 9.21%The average CTR for Facebook ads is 0.9% across all industries. The industries with the highest Facebook CTR are:
- Legal advertisers – 1.61%
- Retail – 1.59%
- Apparel – 1.24%
- Beauty – 1.16%
- Fitness – 1.01%
The average Conversion Rate (CVR) on Facebook ads is 9.21%. The industries with the highest CVR are:
- Fitness – 14.29%
- Education – 13.58%
- Employment & job training – 11.73%
- Healthcare – 11.00%
- Real Estate – 10.68%
- B2B – 10.63%
Number of ad clicks ÷ number of ad impressions x 100 = click-through rate34. Facebook's global average revenue per user reached $9.62
Facebook, now called Meta, uses the ARPU (average revenue per user) metric to track its success. In April 2023, its ARPU reached $9.62. If you look at the quarterly change, the ARPU dropped by 11% (January – April 2023). The annual change in its ARPU was +0.8 (April 2022 – April 2023).
Facebook restricts the usage of its platform for people aged below 13 years. In 2022, 63.7% of Americans aged 13+ were reachable through Facebook ads. At the start of 2022, 54.8% of Facebook's ad audience in the USA was females, while 45.2% were males.
Based on the numbers published by Facebook's 'Insights tool in June 2021, the typical Facebook user aged 18+:
- Clicked or tapped a media of 12 Facebook ads (including sponsored posts) in the previous 30 days.
- The numbers also showcased a typical female user clicked 14 ads in June 2021, while male only clicked 10 ads.
- Male users aged 18-24 clicked 8 ads per month, and male users aged 25-34 clicked 10 ads/mo.
Conclusion
So, there you have it, folks! A quick tour of the extensive world of Facebook statistics.
But why do these numbers matter?
The stakes are high, with 3 billion monthly active users, and the opportunities are boundless. The demographic, engagement, business, and advertising insights we've explored here are not just numbers. Together, they form a compass guiding businesses toward a meaningful presence and lucrative growth.
By leveraging these insights, businesses can craft strategies that resonate, campaigns that captivate, and posts that stick.
Ready to turn these stats into success stories? The digital realm of Facebook awaits, and with these insights in hand, the horizon has never looked brighter!
Want to know more?
Take a look at these social media statistics for 2023.
And if that's not enough, we have curated statistics by individual social media platforms:
- Instagram statistics
- Twitter statistics
- LinkedIn statistics
- TikTok statistics
- Pinterest statistics
- Snapchat statistics
Source: Social Pilot

36 Facebook Statistics and Facts for Every Marketer in 2023
The importance of Facebook (Meta) for small businesses - Blog
Hootsuite: Instagram Stats Need to Know in 2023 - Blog
Wordstream: Meta Ads vs. Google Ads: 6 Key Differences - Blog

Instagram for small business - Blog

How a small business can benefit from an online presence - Blog

Presentation website for small business: Everything you need to know - Blog
When you subscribe to the blog, we will send you an e-mail when there are new updates on the site so you wouldn't miss them.
